Analyst-Rikoo-Portfolio
| Certified Data Analyst | Lagos, Nigeria |
Live Portfolio Website : https://analystrikoo.github.io/Analyst-Rikoo-Portfolio/
Excel · SQL · Power BI · Tableau
I build practical tools and dashboards that turn raw data into clear, actionable insights for freelancers, small businesses, and teams.
This portfolio showcases my hands-on projects. All files are downloadable, and screenshots show how they work.
Projects
1. Freelancer Payment Tracker (Excel)
Excel template for freelancers and remote workers to track invoices, payments, and cash flow.
What it does:
-
Automatically calculates Paid / Overdue / Pending status
-
Interactive dashboard with slicers to filter by client or status
-
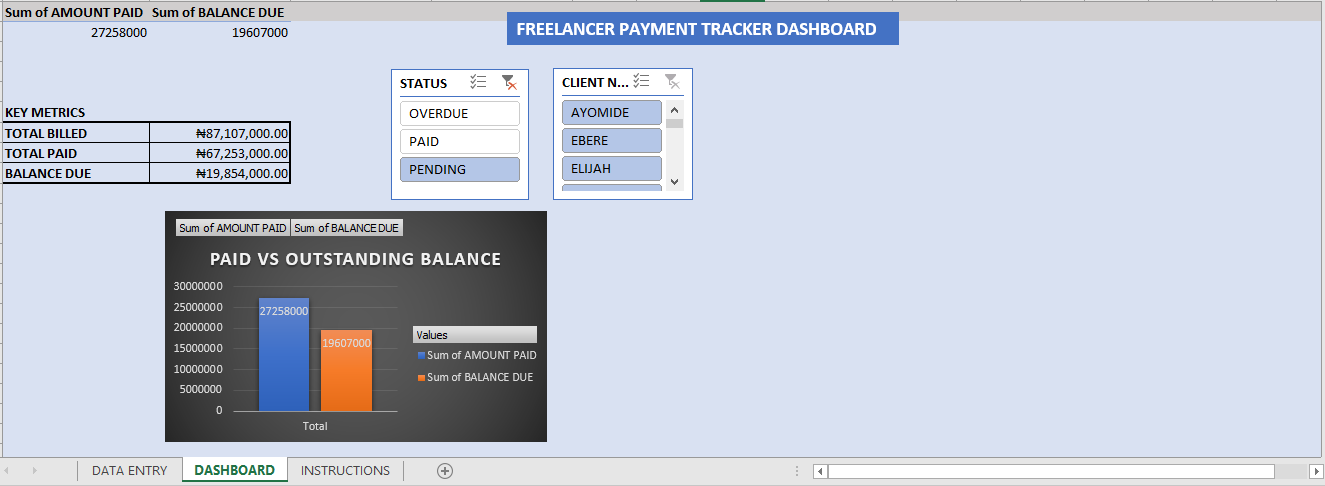
Key metrics: Total Billed, Total Paid, Balance Due
-
Charts: Paid vs Outstanding Balance
-
Conditional formatting for visual alerts
How to use:
-
Download the template below
-
Enter your invoices in the “DATA ENTRY” sheet
-
Go to “DASHBOARD” sheet — slicers and visuals update automatically
-
Refresh PivotTables if needed (right-click → Refresh)
Download Template:
Download FREELANCER-PAYMENT-TRACKER.xltx
Screenshots:
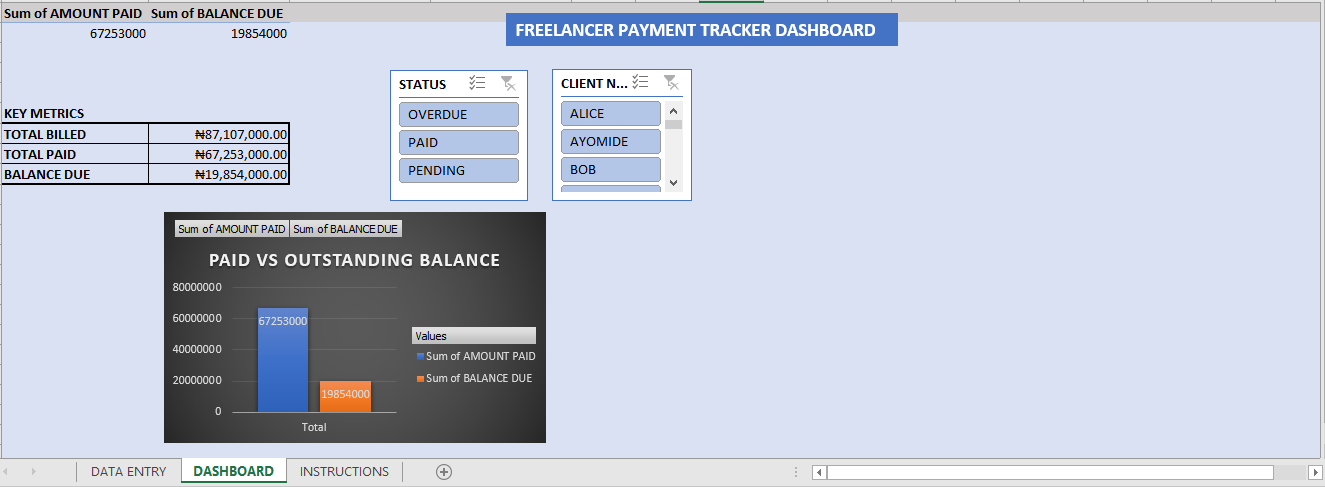 Dashboard overview with key metrics, chart, and slicers
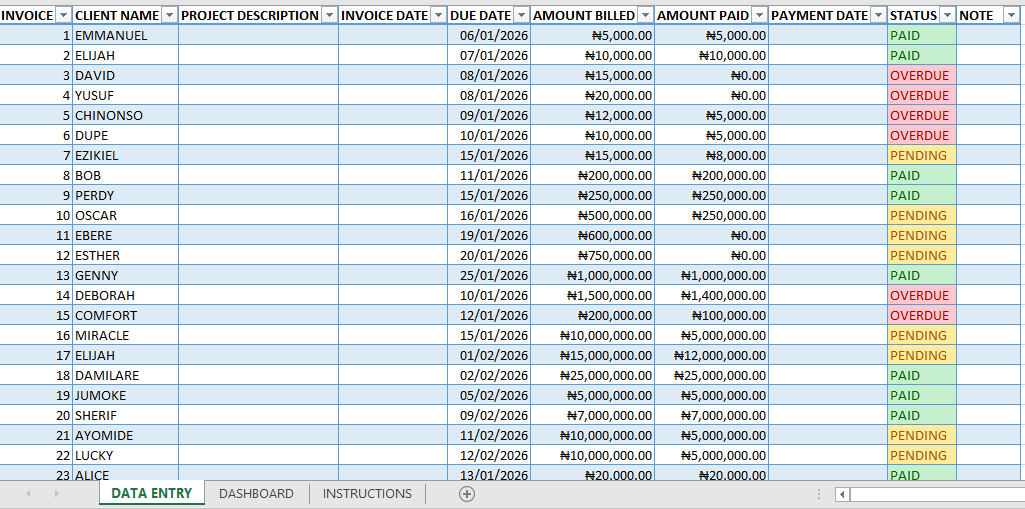 Data entry sheet with sample invoices
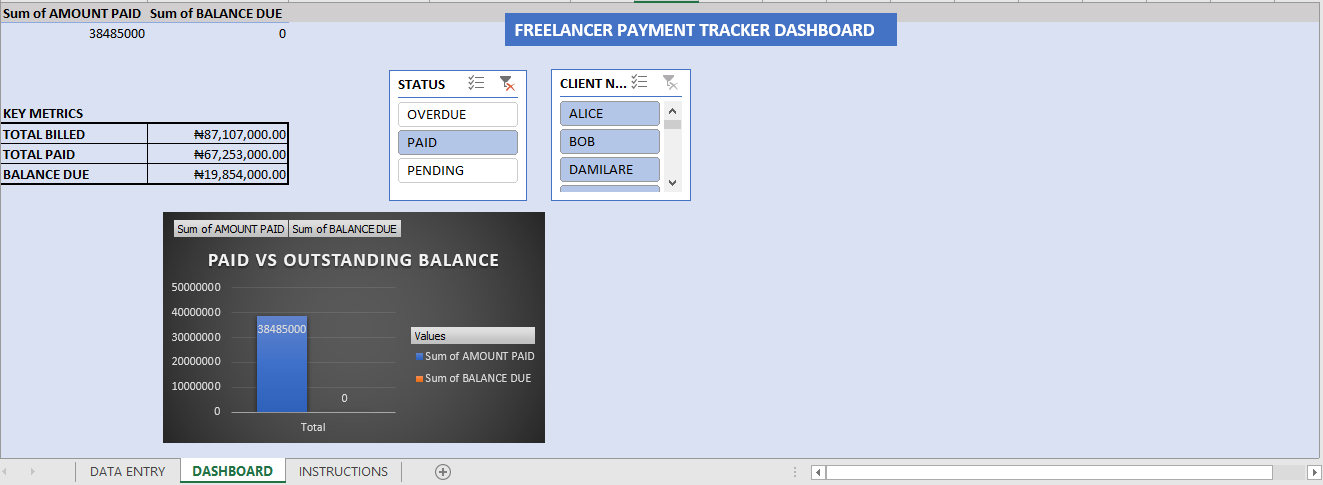 Example with Paid slicer filtered
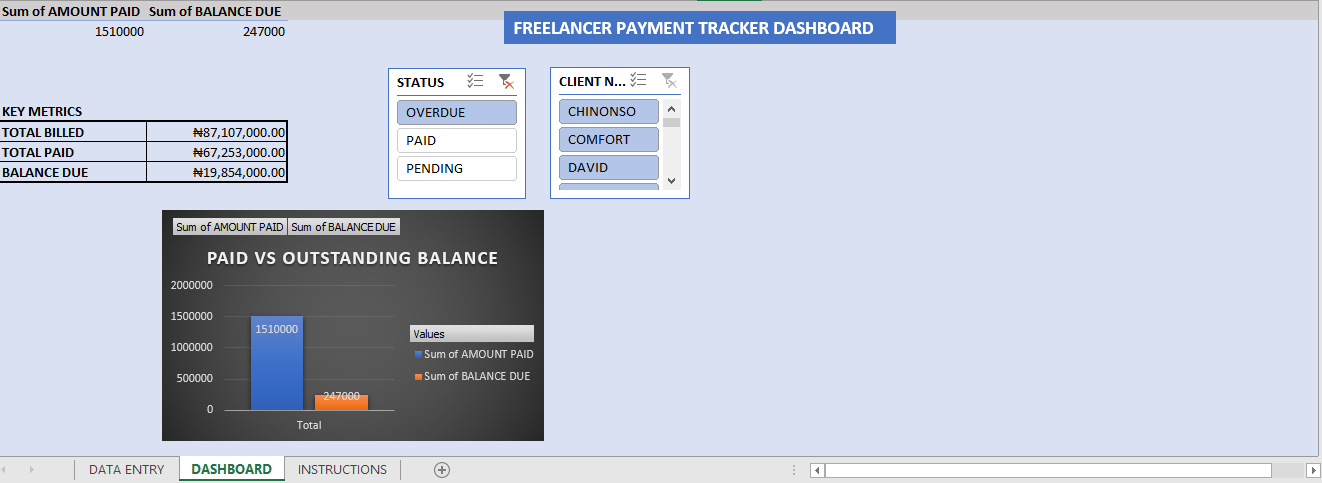 Example with Overdue slicer filtered
 Example with Pending slicer filtered
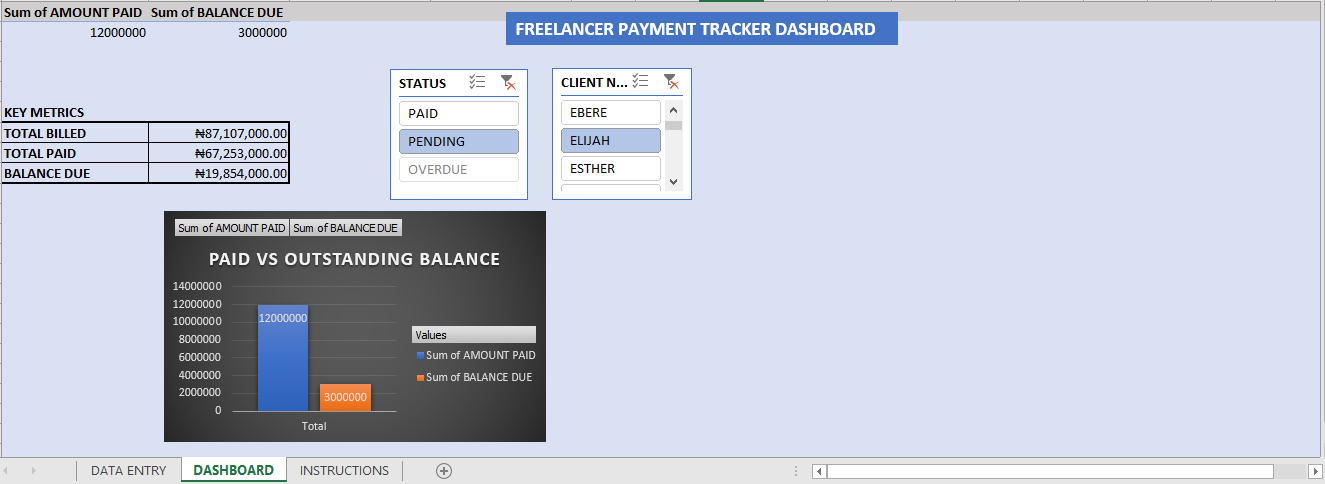 Example with Status + Client filtered
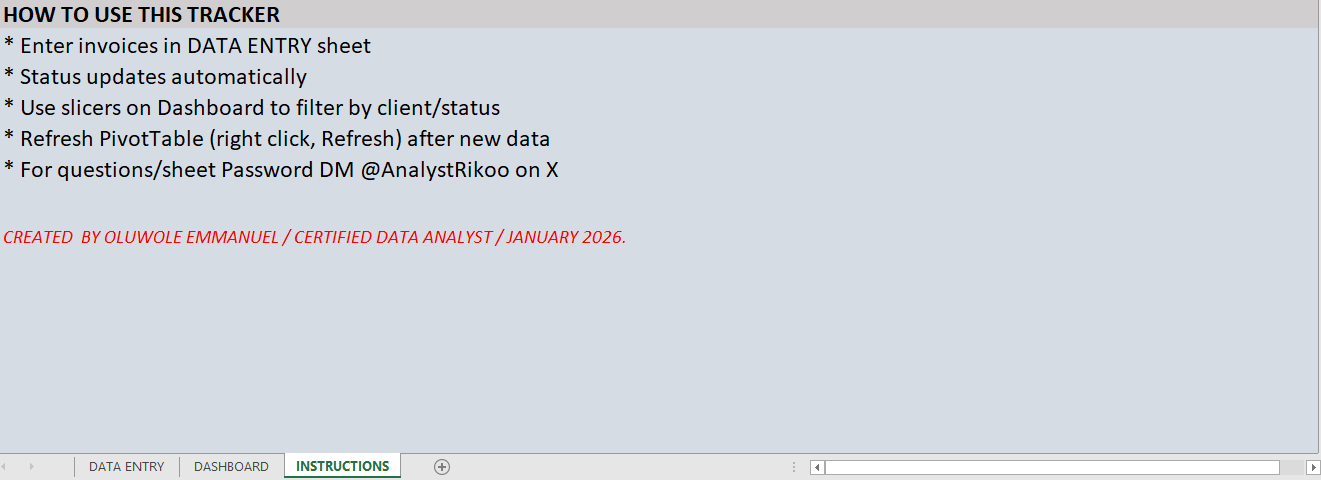 Instructions sheet
2. Cookies Sales Dashboard (Power BI)
Interactive Power BI dashboard analyzing restaurant cookie sales data for a chain of outlets.
What it is and problems it solves:
This dashboard transforms raw sales data into clear, actionable business insights — helping restaurant managers and owners quickly:
- Identify top-performing restaurants by revenue and profit
- Spot underperforming locations and cost inefficiencies
- Understand revenue distribution and customer patterns
- Make faster, data-driven decisions to optimize operations and increase profitability
What it does (key features):
- KPI cards: Total revenue, cost, profit, cookies shipped, customer count
- Revenue share by restaurant (pie chart)
- Profit comparison by restaurant (bar chart)
- Detailed sales table with filters
- Slicers to filter by restaurant name
- Full interactivity: hover tooltips, cross-filtering, dynamic updates
How to use:
- Download and open the PBIX file in Power BI Desktop (free).
- Use the slicer on the right to filter by any restaurant name.
- Interact with charts and cards — click bars/pies to cross-filter, hover for details.
- View raw data on the “Data Source” page, calculations on “Analysis” page, and usage guide on “Instructions” page.
- Refresh data if connected to external sources (Home → Refresh). Download PBIX File COOKIES-SALES-DASHBOARD.pbix
Screenshots (direct raw links):
Data Source Page
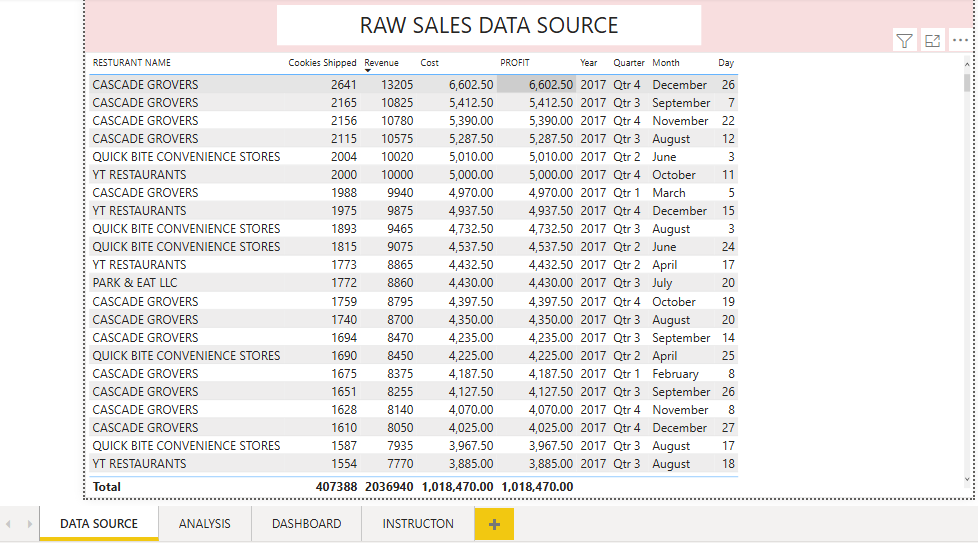 Raw sales data table used as the foundation
Analysis Page
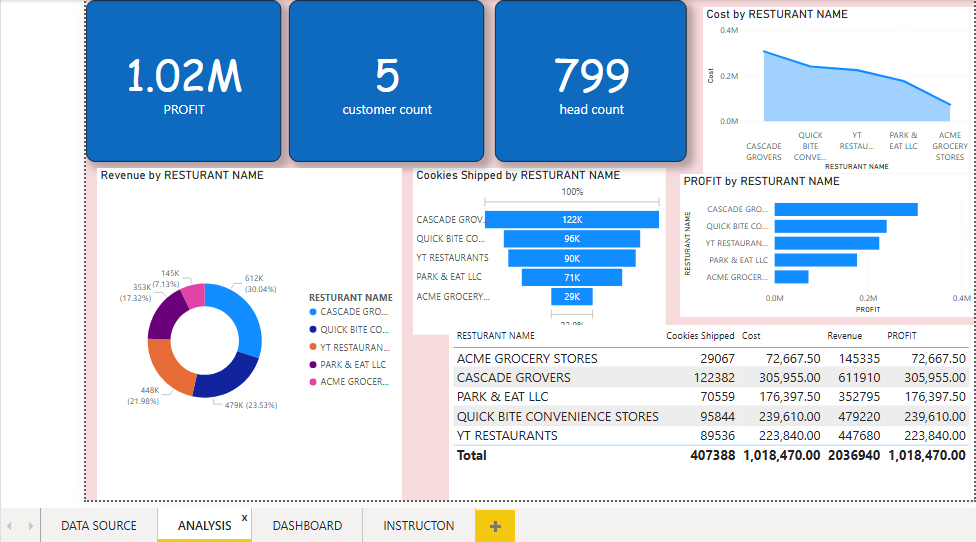 Data preparation, measures, DAX calculations, and intermediate analysis view
Dashboard Overview
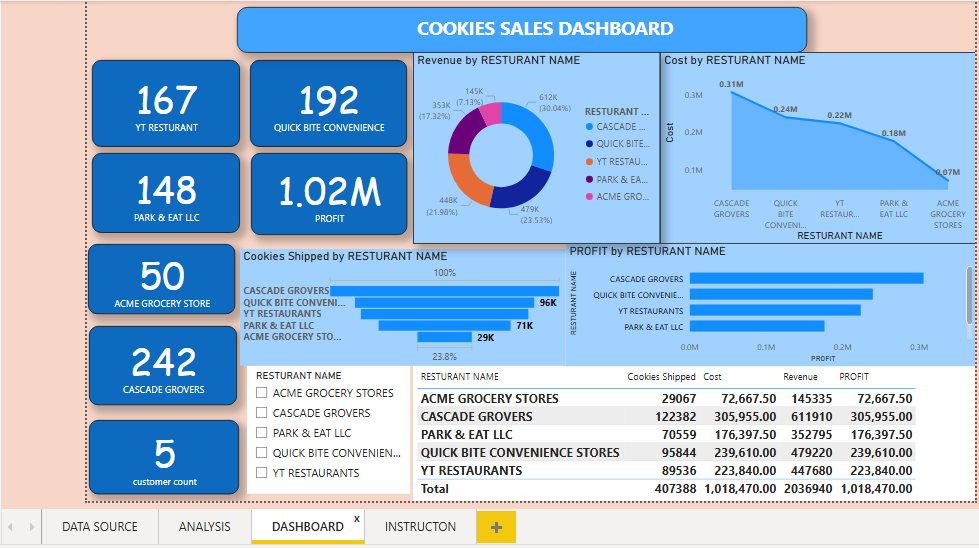 Main interactive dashboard with KPIs, revenue pie chart, profit bar chart, table, and slicers
YT Restaurant Filtered
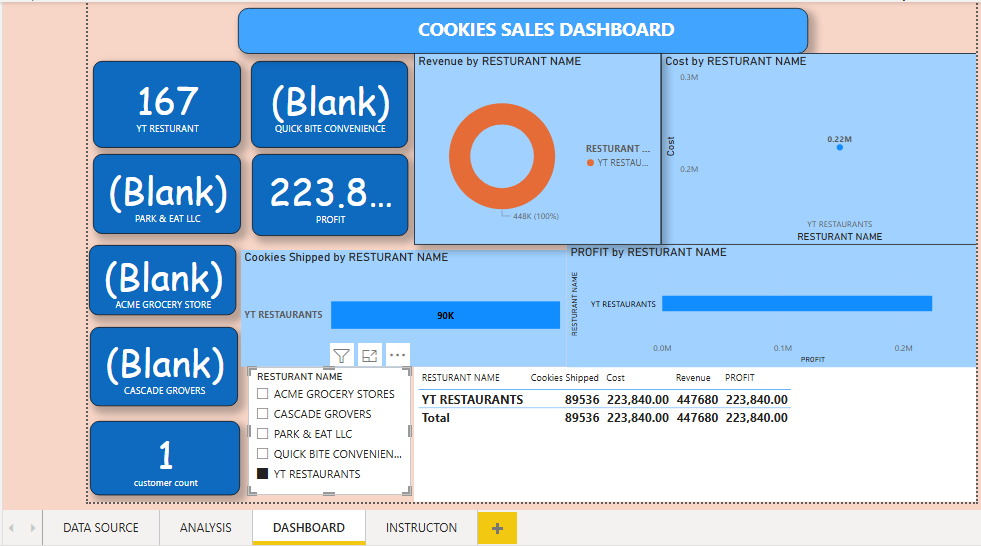 Dashboard filtered by YT Restaurant (shows interactivity)
Quick Bite Convenience Filtered
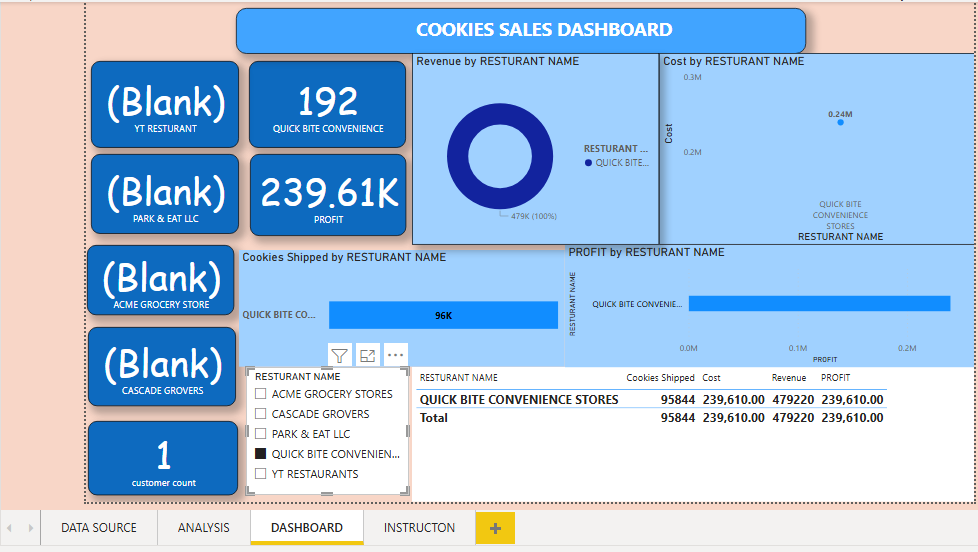 Dashboard filtered by Quick Bite Convenience (shows interactivity)
Instructions Page
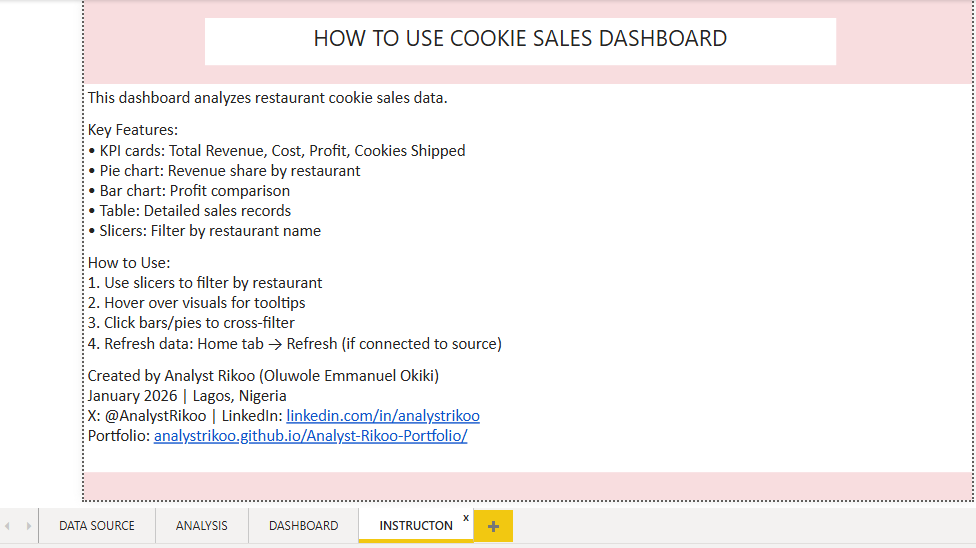 How to use and interpret the dashboard
Full Project Files COOKIES-SALES folder
About Me & Contact
-
Based in Lagos, Nigeria (open to remote work)
-
Open to entry-level data analyst roles, freelance gigs (custom Excel templates, data cleaning, simple dashboards), collaborations, and feedback
Connect:
- X: @AnalystRikoo
- LinkedIn: [https://www.linkedin.com/in/analystrikoo]
- Email: emmanueljeari@gmail.com
Last updated: January 2026